


Spreadsheets are everywhere. Budgets, reports, surveys, tracking sheets. They hold useful information, but they are rarely pleasant to read. Once a file grows beyond a few rows, understanding what it actually says often takes more time than expected. You scroll, filter, scan columns, and still feel unsure whether you’ve caught the important part.
That’s where summarizing spreadsheets becomes helpful. Instead of working through rows one by one, you can start with a clear overview. Key numbers, major categories, and noticeable patterns stand out first, and you decide where to look deeper.
In this guide, you’ll see how to summarize Excel and CSV files into clear, visual mind maps, making spreadsheet data easier to understand and reuse.
Why Summarize Excel/CSV Files
Excel and CSV files are designed to store data, not to explain it. Summaries help turn raw tables into something you can actually work with.
Get to insights faster
Large spreadsheets often hide what matters most. A summary helps surface trends, totals, and unusual values without digging through every row.
Explain the data more clearly
Tables are hard to share with people who didn’t create them. A summarized view makes it easier to explain results to teammates, clients, or stakeholders without walking through the entire file.
Reduce mental fatigue
Reading spreadsheets requires constant back-and-forth between rows and columns. A summary narrows the focus to the information that deserves attention.
Support decisions and planning
Whether you’re reviewing finances, survey results, or operational data, summaries help you move from “what’s in the file” to “what should we do next” more quickly.
Reuse insights without reopening the file
Once a spreadsheet is summarized, you can reuse the insights in reports, presentations, or notes without starting from scratch every time.
How to Summarize Excel and CSV Files into a Mind Map
Mapify offers a simple way to turn spreadsheet data into a visual overview. Instead of staring at rows and columns, you can see how different parts of the data relate to each other at a glance. It's an AI mind map summarizer that turns any content into mind maps within seconds, including documents like Excel, CSV, Word, PDF, PowerPoint, etc.
Mapify also supports YouTube videos, web page links, images, ebooks, and audio files. If you want to get a professional report with cited sources, you can try the Deep Research function to proceed.
Instantly turn your content into mind maps with AI
Get Started NowStep 1: Upload Your Excel or CSV File
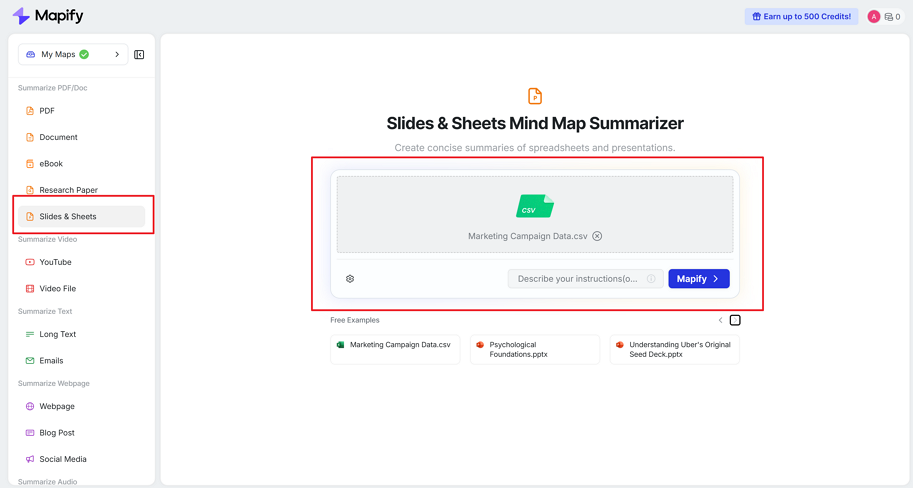
Log in to Mapify and upload your Excel (.xlsx) or CSV file from the Slides & Sheets section. You can see some free examples to try. Or upload your own file and describe your instructions.
Step 2: Generate a Clear Summary and Refine
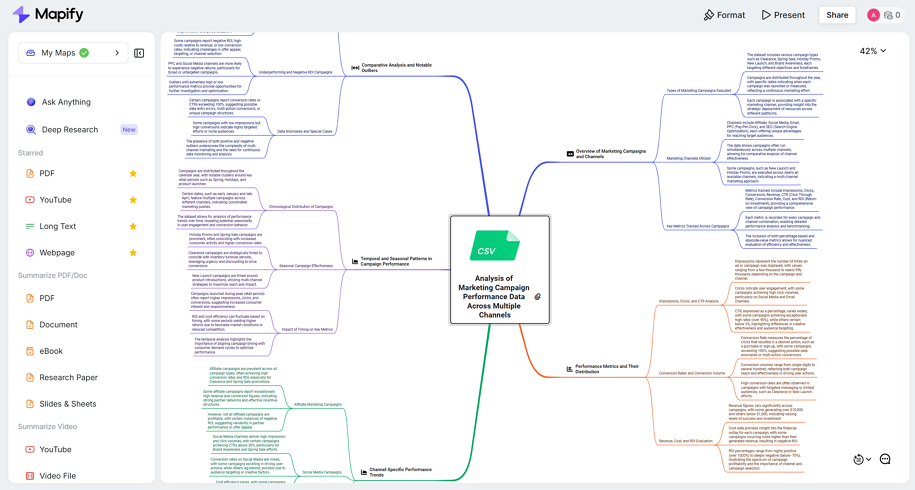
After uploading, Mapify creates a summarized mind map of the spreadsheet, which includes key categories or metrics, and sub-branches highlight important details or trends. You can adjust it to match how you think:
- Move branches to reflect your analysis
- Add notes to highlight important findings
- Ask follow-up questions about specific numbers or categories
This is especially useful when you want to understand why certain patterns appear or when preparing insights to share with others.
Step 3: Export or Share the Summary
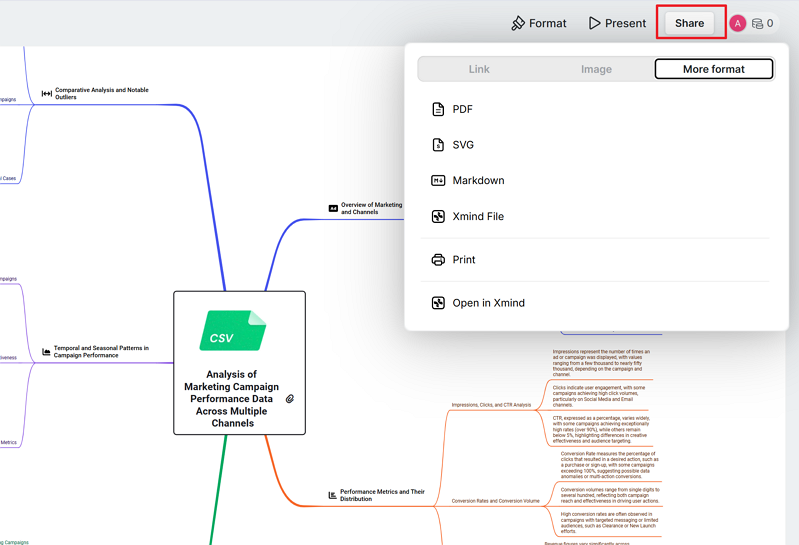
When everything looks right, click on the Share button to export the summary as a PDF, image, or structured text file. You can also share a link so others can view the summary without opening the original spreadsheet.
FAQ: Summarizing Excel & CSV Files
Can Excel and CSV files really be summarized accurately? Yes, as long as the data is clean and well-organized. Files with clear headers and consistent values produce the most reliable summaries.
What types of spreadsheets work best? Financial data, surveys, sales reports, and tracking sheets are usually good candidates. Extremely messy files may need light cleanup first.
Can summaries help explain trends or unusual values? They can. Once a summary is created, it becomes easier to notice patterns and ask follow-up questions about what stands out.
What’s different about a mind map summary? Instead of reading a block of text, you see how data points connect. This makes complex spreadsheets easier to understand and explain.
Can I summarize only part of a file? Yes. You can focus on specific sheets or sections if you don’t need the entire file summarized.
Is this useful if I’m not good with spreadsheets? Very much so. Summaries reduce the need for formulas or advanced Excel skills, making data easier to work with for non-technical users.
Conclusion
Excel and CSV files are great at holding information, but not always great at helping people understand it quickly. Summarizing spreadsheets makes it easier to see what matters, spot patterns, and move forward with confidence.
By turning spreadsheets into mind maps, Mapify helps shift the focus from managing tables to understanding data. Whether you’re reviewing reports, analyzing results, or preparing insights for others, summarizing Excel and CSV files can save time and make your data far more approachable.
Instantly turn your content into mind maps with AI
Get Started Now.png)


.png)